

The Ballon d’Or Tree: How Probability Narrows with Each Branch
Imagine you’re walking through a giant branching tree, each step narrowing your possibilities until you reach a final outcome. This is exactly how a probability tree works—it breaks big possibilities into smaller, more likely outcomes with every decision or factor. Let’s explore this idea with one of football’s greatest honour’s: the Ballon d’Or.
The Ballon d’Or is awarded annually to the world’s best footballer. Over the past century, hundreds of footballers have been in contention. But by understanding the data, we can break down the likelihood of a player winning based on the club they play for. Here’s how it looks:
The First Split: Spain vs. Non-Spain Clubs
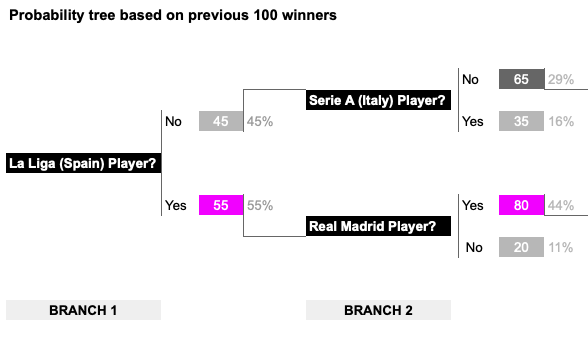
First, let’s divide the football world into two branches: players who played for Spanish clubs and those who didn’t in the year they won the Ballon d’Or.
• About 55% of Ballon d’Or winners in the past 100 years have played for Spanish clubs, highlighting Spain’s dominance in world football.
• The remaining 45% come from non-Spanish clubs, spanning leagues across Italy, Germany, England, and more.
The Spanish Branch: Real Madrid or Other Spanish Clubs
For those in the Spanish club branch, the next key question is: Did they play for Real Madrid or some other Spanish club?
• A whopping 80% of Spanish club winners were Real Madrid players. With legends like Alfredo Di Stéfano, Cristiano Ronaldo, and Luka Modrić, Real Madrid has a storied history of producing Ballon d’Or winners.
• The remaining 20% played for other Spanish clubs, with FC Barcelona players like Lionel Messi often taking the spotlight.
The Non-Spanish Branch: Italy, Germany, or Other
If a winner didn’t play in Spain, we look at their club’s country. This branch splits into three major categories: Italian clubs, German clubs, and other countries.
• 35% of non-Spanish winners played for Italian clubs, like AC Milan or Juventus. This reflects the strength of Serie A during the 1980s and 1990s, with stars like Marco van Basten and George Weah.
• 30% hailed from German clubs, most notably Bayern Munich, home to legends like Gerd Müller.
• The final 35% were from other leagues, including England’s Premier League and even smaller leagues. George Best, for example, won while playing for Manchester United.
A Real-Life Example
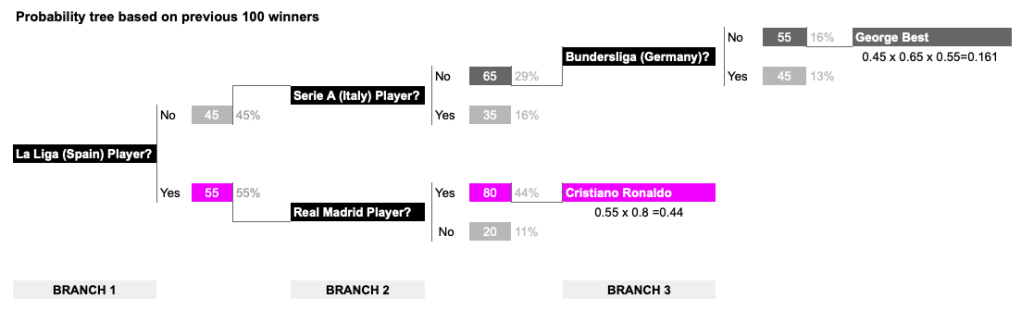
Let’s use Cristiano Ronaldo as a case study. If we follow the tree:
1. Did he play for a Spanish club when he won? Yes (Spain branch).
2. Did he play for Real Madrid? Yes.
Ronaldo falls in the largest and most predictable branch of the tree. Ronaldo’s categorisation probability is 44%.
Now consider George Best in 1968:
1. Did he play for a Spanish club when he won? No (Other branch).
2. Did he play in Italy? No.
3. Did he play in Germany? No.
Best’s position in the tree is rare: a Ballon d’Or winner for an English club outside of Spain, Italy and Germany. His category probability is 16%.
Chances of Ronaldo receiving the award are roughly over 2.5 times greater than Best (of course this is hypothetical that they played at the same time and human biases and other factors remained consistent).
Why Probability Trees Matter
This branching logic shows how probabilities narrow as you consider each factor. By looking at historical data, we can make educated guesses about future winners. For instance, if a player is already playing for Real Madrid, their chances of winning the Ballon d’Or are significantly higher than someone at a smaller club.
A probability tree helps us see patterns and predict outcomes in a simple, visual way. In football, as in life, every decision and factor narrows the possibilities—and increases the odds of greatness for those on the right branch.
This branching logic isn’t just about football. It’s a metaphor for understanding how likelihoods shift and sharpen in everyday scenarios, from career paths to game strategies. So, next time you’re looking at probabilities, think of the Ballon d’Or tree and the winding path to the top.
